Line Chart Story Draw
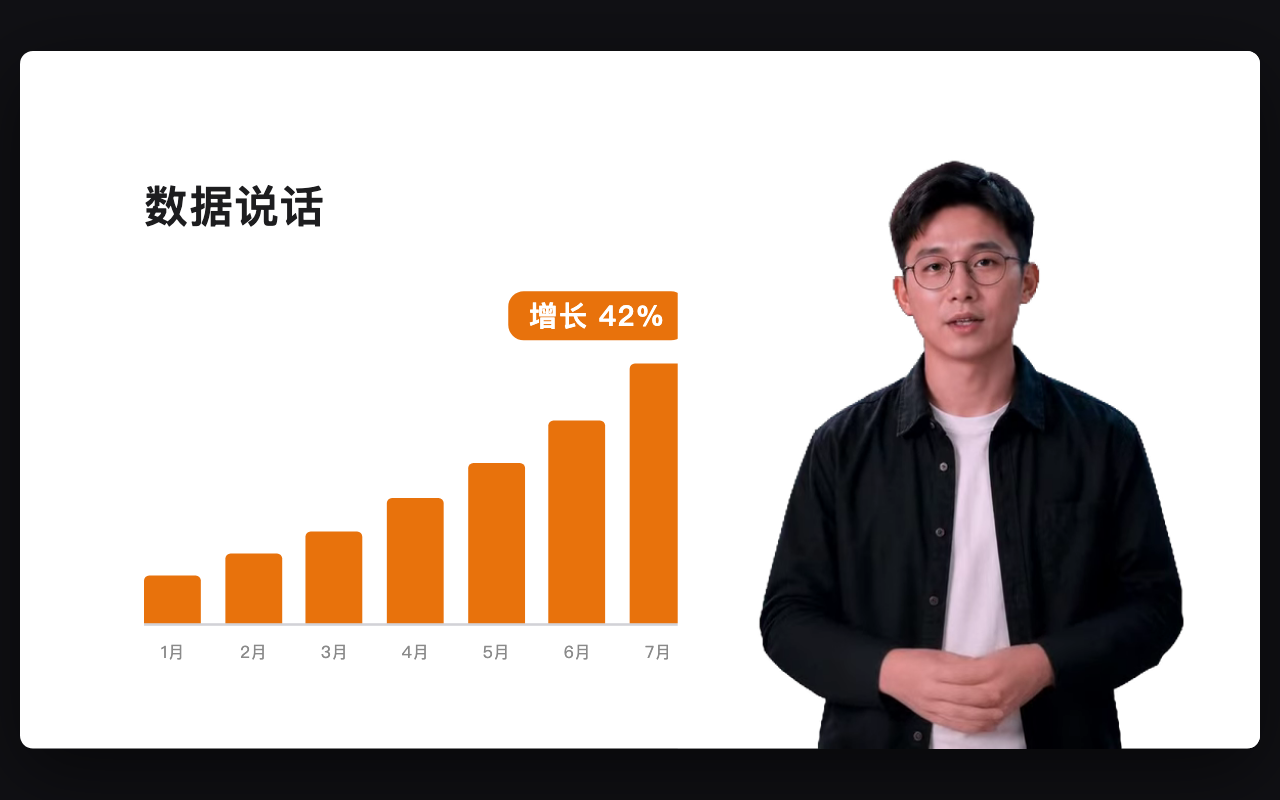
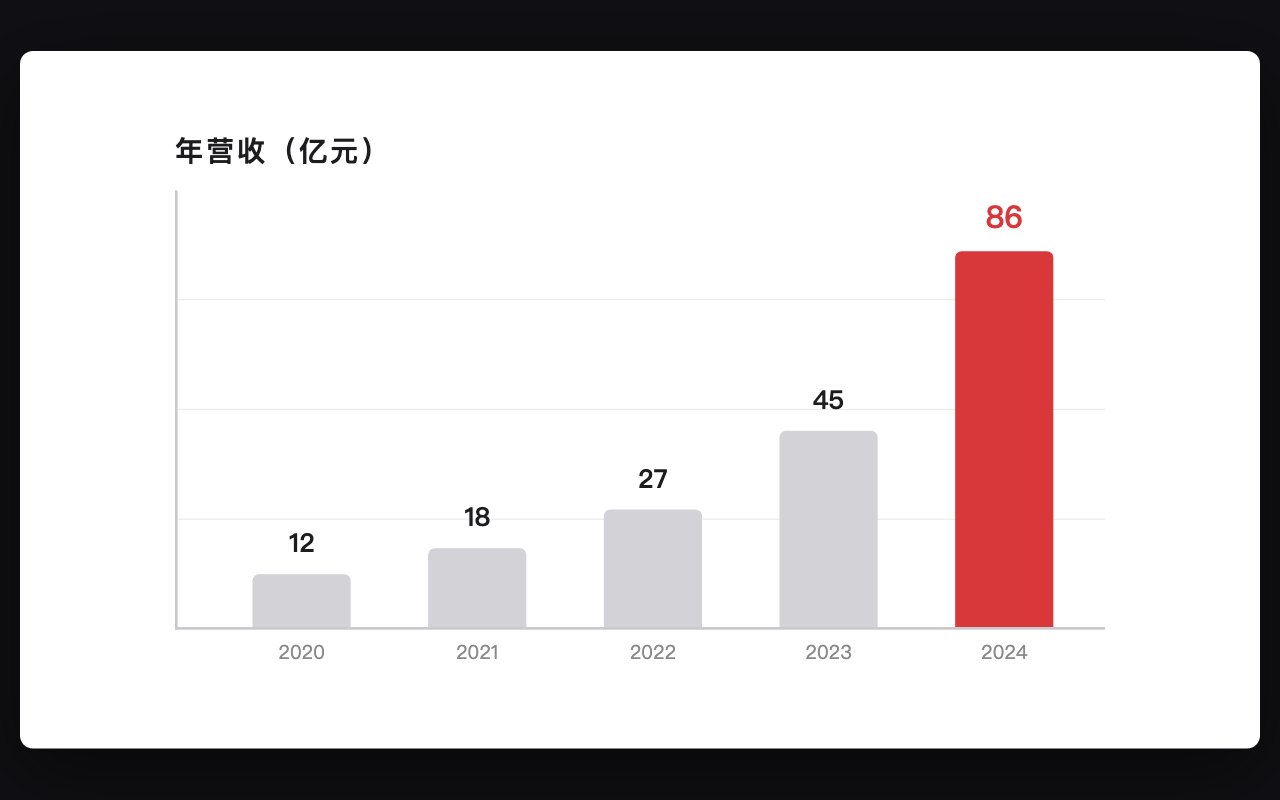
The history segment is on screen from the start; when the narration reaches the hypothesis, new line segments stroke-grow rightward from the pivot over 0.4~0.8s, a ▲5% label + arced arrow pop the instant a segment completes, a dashed comparison line then forks a second future from the same pivot, and vertical color bands finally veil the relevant intervals one by one
Now showingline-chart-story-draw
Original demos may contain Chinese on-screen text.
line-chart-story-draw
View recipe
Loading recipe…
Data & Charts